Dr Keping Chen from the Macquarie University says innovative approaches are necessary for large-area flood mapping across the Asian region. He introduces three major flood projects which Risk Frontiers at the university has developed.
It has long been recognised that Southeast Asia is the world’s most flood-prone region by virtually all accounts, including the flood magnitude and frequency, the severity, the number of countries affected, the size of inundation extent and the number of people at risk.
This is understandable given the region’s unique environmental and socioeconomic setting for major and extreme floods: some of the world’s largest catchments and rivers, frequent and enormous seasonal monsoons originating from the Indian Ocean and the Pacific Ocean, the world’s most dense settlements, and the fact that many of the world’s megacities and concentrated exposures are located on low-lying land just next to major rivers and coasts.
Flood risk on the increase
Flood risk in the region is on the increase. Over the past few decades, increasing population, intensifying urbanisation and developing economies (at rates all faster than global averages), lack of proper long-term land use planning and limited capacity for adaptation have exacerbated the severity of flood risk. Global climate change and sea level rise add to this predicament.
Major and extreme floods in vast, low-lying and river-dominated deltas are often the result of torrential rains induced by tropical cyclones (typhoons) and associated storm surges.
Figure 1 illustrates the distribution of some of these deltas prone to all forms of flooding (riverine, flash and coastal). Some of the most catastrophic events that have hit the region include:
• The 2011 Thailand Floods impacted the entire Chao Phraya river system (Thailand’s largest catchment covering about 35% of the country) and inundated parts of the capital, Bangkok. The event lasted several months and caused more than 800 deaths and affected 13.6 million people. The World Bank reported total economic losses (mainly for damage to the assets of the manufacturing industry) of US$45.7 billion (2011 value), making this the world’s fourth costliest disaster.
(The top three costliest disasters up to 2011 were the 2011 Tohoku earthquake and tsunami in Japan, the 1995 Kobe earthquake, and Hurricane Katrina in 2005.)
• 2008 Cyclone Nargis in Myanmar caused at least 138,000 fatalities and a loss of US$10 billion (2008 value).
• 1999 Odisha Cyclone in India caused over 9,800 fatalities and destroyed 275,000 homes. The total economic loss was about US$4.5 billion (1999 value).
• 1991 Bangladesh Cyclone made landfall in the Ganges-Brahmaputra Delta killing over 138,000 people and destroying about 1 million homes, and leaving as many as 10 million homeless. The typhoon caused an estimated loss of US$1.5 billion (1991 value).
• 1881 Haiphong Typhoon devastated the Red River Delta in Vietnam and reportedly killed up to 300,000 people.
Many other economically-important deltas in the region, including the Mekong Delta, and the Zhujiang Delta and the Changjiang Delta in China, are all invariably prone to super typhoon impacts and flooding.
Unfortunately, detailed flood mapping data for the region is rarely available to the general public or in the public domain, a situation that also holds true for the majority of world. There is a greater need to better understand and map the flood risk using innovative and insightful approaches based on the best regional and global data sets currently available. The resulting flood maps should interest high-level authorities and insurers alike.
Flood mapping
Flood mapping with hydrodynamic models (hydrological and hydraulic models) is widely used to determine a range of physical attributes of the flood hazard, such as water levels, inundation extent and flow velocity. It is usually carried out for small areas (at catchment or sub-catchment level) and flood maps are produced at various design flood levels such as at 1% Annual Exceedance Probability (AEP) and at a Probable Maximum Flood (PMF) level.
Research and development of large-area flood mapping (at an entire catchment level and beyond) has become more active across both industry and academia, especially after the widespread flooding in Australia in late 2010 and early 2011, the 2011 Thailand flood and the 2013 Central European floods.
Flood mapping requires a set of good-quality inputs, such as detailed Digital Terrain Models (DTMs), river networks, long-term rainfall records, reliable historical water levels and river discharge records. Unfortunately, for many countries these data do not comprehensively exist. In addition, it is often computationally prohibitive to run flood models for large areas. These factors put significant constraints on the application of flood mapping for large areas.
Three levels of flood mapping
Large-area flood mapping has to be innovative and practical. Amongst the new developments, the “direct-rainfall” (rainfall on the grid) approach that simplifies underlying hydrological processes has been explored by many with some degree of success.
This new development could produce approximate flood-prone areas, but detailed hydrodynamic features and processes are compromised.
Depending upon the application in mind, areal coverage, data availability, the output detail and calibration required and available budgets, flood mapping can be examined at various levels, eg
• Level 1: Broad-scale mapping to delineate floodplains and those areas not subject to flooding.
• Level 2: Medium-level mapping based on observed historical water levels and flows.
• Level 3: Detailed mapping with a full, proper hydrodynamic analysis. This is only practical if the study area is relatively small.
Australian experience and case studies
For more than a decade, Risk Frontiers at Macquarie University has been heavily involved in flood risk assessment and riverine flood mapping for the whole continent of Australia. It has developed three major flood projects at various levels:
• The National Flood Information Database (NFID), through a subsidiary company, under contract to the Insurance Council of Australia (ICA).
• Flood Exclusion Zones (FEZ) mapping to identify the national locations with little or no flood risk from riverine flooding.
• FloodAUS, a loss model that integrates the address-level flood hazard data from NFID and FEZ databases, exposure locations and types, and region-specific building vulnerability footprints.
The main inputs for NFID flood risk mapping are flood levels at various return periods from specific flood studies, high-resolution Digital Terrain Models, and property addresses from the Geocoded National Address File.
By integrating these comprehensive spatial data layers (usually from local government authorities and state governments), address-level flood risk ratings are produced in a nationally consistent form, primarily for insurance applications. The majority of the most flood-prone addresses (ie at 1% AEP) in Australia have been analysed.
Risk Frontiers has also developed a methodology that evaluates and determines broad-scale Flood Exclusion Zones for addresses that lie in regions where properties may be at risk of riverine flooding but either no flood information exists or is not publically available.
The FEZ methodology quantifies a set of terrain metrics (eg distance to rivers, elevation difference between an address and nearby rivers, slopes and stream orders) that characterise floodplains at the catchment level and account for hydrological processes. Its development employs large, high-quality data sets on elevation, river networks and known locations with observed, empirical flood data. The modelling is both knowledge- and data-driven, and overcomes the limitations of the various crude statistical approaches that ignore inherent catchment features and cannot provide reliable flood risk predictability for larger, heterogeneous real-world floodplains.
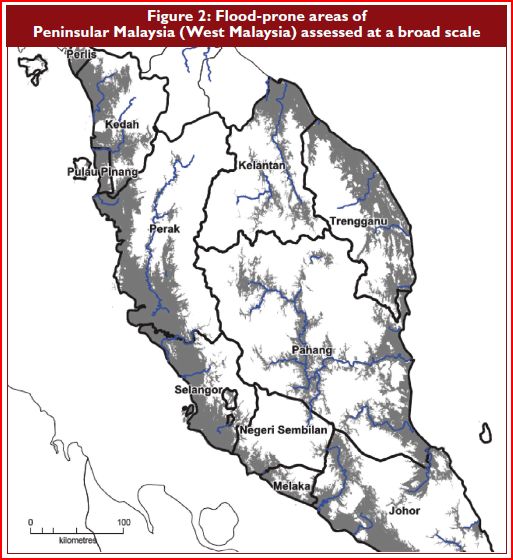
Using the same FEZ methodology, we have recently finished a new case study for Peninsular Malaysia (Figure 2). A range of representative terrain attributes about floodplains, along with hydrologically-conditioned SRTM elevation, delineated river networks and reported historical flood extents, are efficiently explored in a spatial analysis environment. We aim to keep enhancing the methodology and expanding the regional coverage.
Dr Keping Chen is Senior Risk Scientist at Macquarie University, Australia.