Dr Andreas Milidonis from the Nanyang Business School at Nanyang Technological University provides additional insights into the Multi-population mortality risk project. The project which includes analysis to identify common trends that may be driving mortality in several countries can be used to construct mortality/longevity risk-sharing arrangements among market participants both in Asia Pacific and beyond.
In the previous article, we had discussed the motivation behind the Multi-population project which is being conducted at the Insurance Risk & Finance Research Centre (IRFRC) at Nanyang Business School. This can be quickly summarised as:
1. To deliver a comprehensive mortality database for the Asia Pacific (APAC) region
2. To identify common cross-sectional and time-series trends in the APAC region
3. To propose longevity risk sharing mechanisms.
In this article, we provide additional general trends in mortality in the APAC region, which are used in two academic studies at the IRFRC to construct mortality/longevity risk-sharing arrangements among market participants both in APAC but also beyond.
Data used in figure 1 are from the 11 countries in APAC with available aggregate population death rate data (Australia, Hong Kong, Japan, New Zealand, Philippines, Singapore, South Korea and Taiwan). For comparison purposes, we also show data from five Western countries: Canada, France, Germany, UK and US.
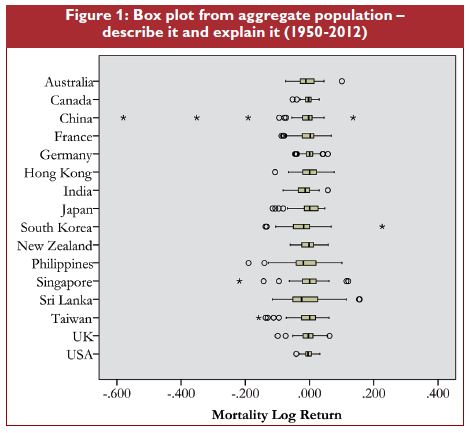
To make the data stationary, we calculate the logarithmic one-year return of population death rates. Data from 1950-2012 are used. The box-plot in figure 1 allows several conclusions to be drawn.
Let us first explain how to interpret this graph: focusing on the shaded box for each country, the black line inside each box represents the median of the distribution of log-mortality returns. The left side of the box shows the 25th percentile and the right side shows the 75th percentile. In essence 50% of the observations lie inside the box. Comparing among countries, we observe most countries have a tendency to have negative values as the median is in most cases negative.
In addition, on the box plots, the lines extending to the left and right of each box spread to up to 1.5 times the width of each box, unless the minimum and maximum values fall short of those points. Any points indicated by a circle or an asterisk outside those point show outliers and extreme outliers respectively.
A visual inspection confirms the larger variation in APAC countries than Western countries.
Mortality trend by country and age group
Next, we take a more detailed look in each country’s mortality by looking at specific age groups.
Data availability decreases as eight countries report continuous data within APAC over the period of analysis. The data reported are death probabilities (q_x).
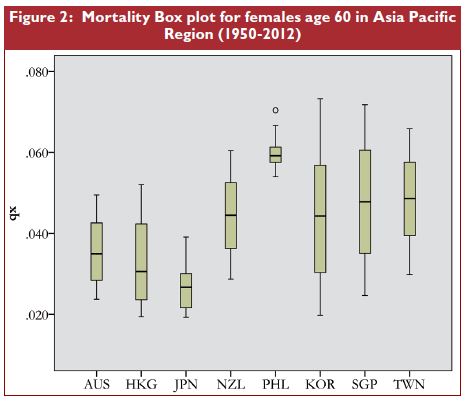
In figure 2, we focus on females age 60-64. We observe the highest mortality risk in Philippines with a relatively tight distribution, while outliers seem to be on the positive end (even higher risk). On the opposite end we find Japan, Hong Kong and Australia with lower mortality risk.
Various mortality trends to be seen
In figure 3, we calculate average (equally weighted) death probabilities for three major geographic regions: Oceania (Australia and New Zealand), East Asia (Hong Kong, Japan, South Korea and Taiwan) and Southeast Asia (Philippines and Singapore).
For illustration, consider the case of Southeast Asia (in black) for the three age groups: age 55-59, age 60-64, and age 65-69. As implied, older age groups have higher death probability.
The figure shows general downward, converging trends for all age groups across East Asia and Oceania, while the results for Southeast Asia (mostly driven by Philippines) show a less downward looking trend. Interestingly, age 55-59 for Southeast Asia, seems to have higher mortality than age 60-64 in the other regions.
Two papers emerge from this project
In one of the two papers to emerge from this project, the time-series predictability of pairs of countries is being analysed. For instance, previous years’ mortality log-returns of one country may provide some predictability for country B. Such predictability would allow for longevity risk transfer mechanisms (see Milidonis and Efthymiou, 2014).
In the second paper to emerge from this project, static and dynamic statistical factors are derived from the cross-section of APAC mortality (Biffis, Lin and Milidonis, 2014).
This analysis allows us to identify common trends that may be driving mortality in several countries but also more country-specific factors that deviate from the common trends. Deviations from the common factors are being used to develop longevity risk-sharing parties within pairs or groups of countries.
Stay tuned for more at www.irfrc.com! Feedback welcome at amilidonis@ntu.edu.sg
Dr Andreas Milidonis is Senior Research Fellow at Insurance Risk and Finance Research Centre (IRFRC), Nanyang Business School, Nanyang Technological University. He can be contacted at amilidonis@ntu.edu.sg.
The IRFRC was established in 2011 to produce research and extend the dialogue on insurance and insurance-related risk in the Asia-Pacific region. The ideas expressed in this article present the views of the named researchers. For more information, please visit irfrc.com.